

Price As of Date: 2/18/25
All my calculations are approximations used to help me establish general decision-making guidelines.
Process Thoughts:
With Amazon I look at operating cash flow. The Price to Operations Cash Flow ratio. Typically, we value companies using Price to Earnings or Free Cash Flow yield. but Amazon is unique. They have publicly stated and made it clear their drive isn’t profits over the last decade its growth and reinvestment. Stock most accurately tracks price to operating cash flow ratio.
So instead of having earnings or free cash (leftover cash they can buy back shares with or pay dividends etc.) they spend it immediately on new projects, or undercutting prices on competitors, etc. so it looks like they are not making much money
This is how I explained it to someone else:
Amazon has essentially said "Hey I’m generating 40+billion a year in cash and telling you ‘Hey look I can generate over 40 billion a year consistently. But here’s the game plan. We are going to spend that 40b a year on research and development, eating away at our competition and capital expenditures so that we take market share, crank out new streams of cash flow and 10 years from now we can turn that off with the flip of a switch and crank out 10x in earnings and cash flow annually. Ride with me” “Follow my operating cash flow to keep tabs on how much I can generate but am choosing to spend to take over"
Here is an image of AMZN's price vs P/Oper Cash Flow
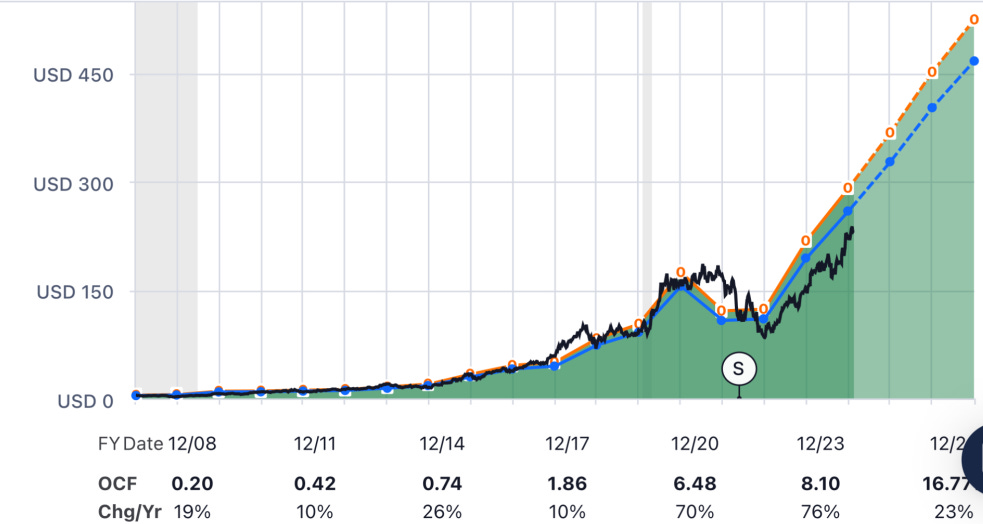
Black is stock price, orange is operating cash flow, and blue is the average Price to Operating Cash flow amazon has historically traded at... so you see, since like 2022 we have dropped below the trend
In the below calculation - Green highlighted is 2 diff Fair Value calcs. One is based off 5-year P/OCF ratio and the other is 10 years. I favor the 5 year. But wanted to provide 2 perspectives. The yellow highlighted prices are all margins of safety/discounts that fall above current price
Quick Calculations 2/18/25 of current price vs historical Price to Operating Cash Flow.
AMZN is currently trading at approx. 20.49 TTM P/OCF and 15.55 FWD P/OCF.
That is approx. 25% below average TTM P/OFC.
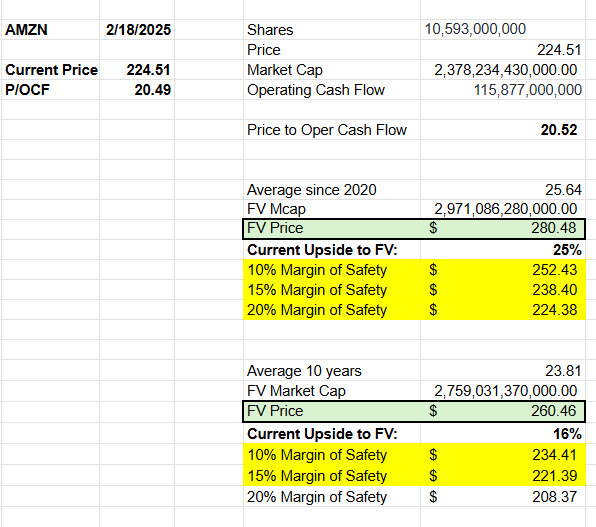
*Note: some numbers slightly differ due to share rounding etc.
Are you finding this content valuable? Subscribe and share it with someone that you feel would benefit!
Longer Term Analysis
I did a Discounted Cash Flow on Operating Cash flow for Amazon and one for Free Cash Flow. This means I am projecting how much cash they will have generated in the next 10 years, coming up with what that value is, and discounting it back to today's dollars at a 10% discount rate
In these Screenshots I bake in a Margin of Safety
For Free Cash Flow one says Margin of Safety of 20% means buy below 237 and I have cushion for error.
For Operating Cash Flow says buy below $254 for cushion for error
Important Note as explained above: I believe Operating Cash Flow to be the best approximator for AMZN valuations. Operating Cash Flow Calculations are below DCF using Free Cash Flow.
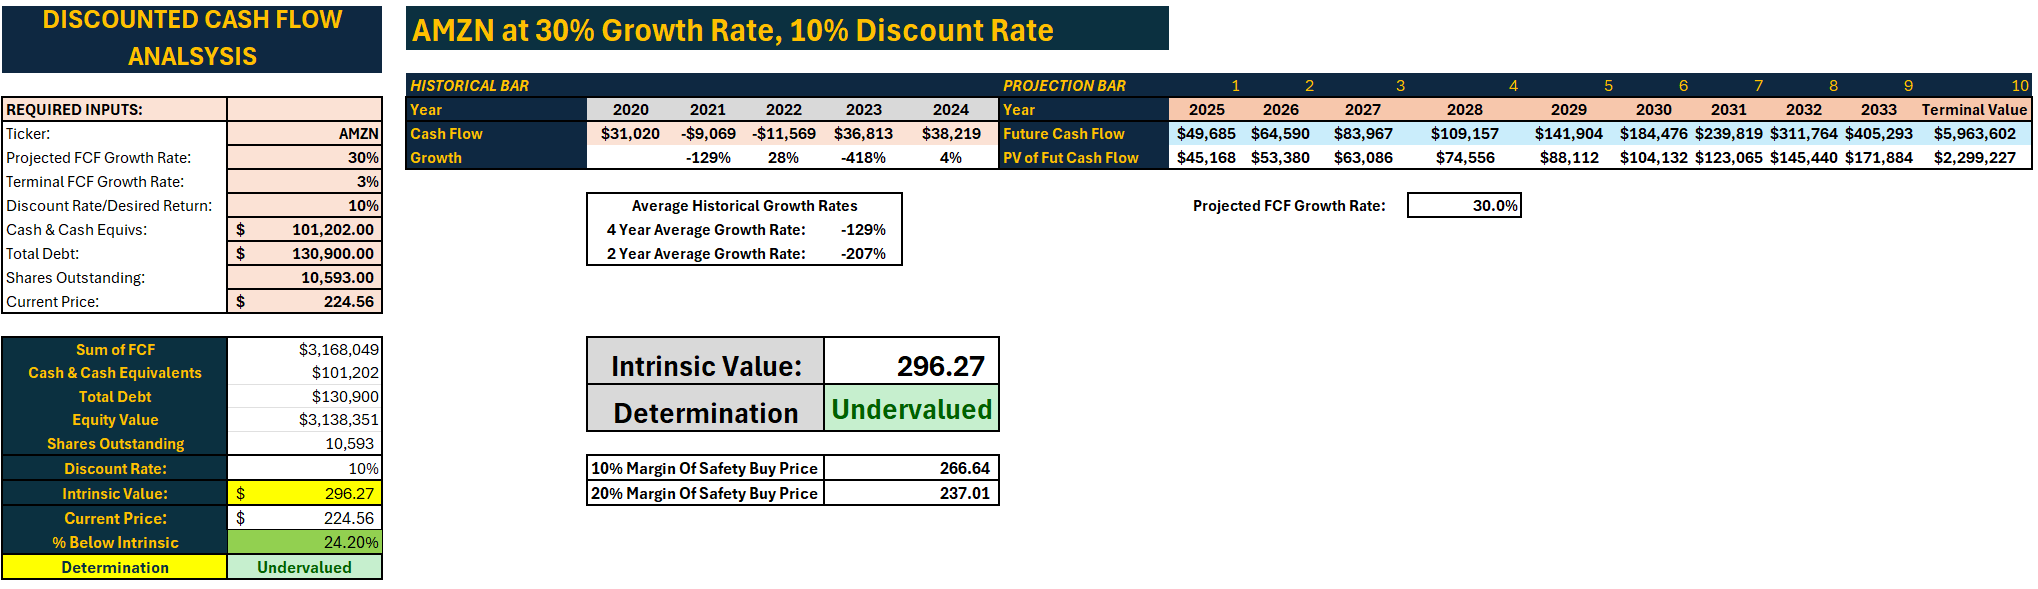
Discounted Cash Flow (Using Free Cash Flow)
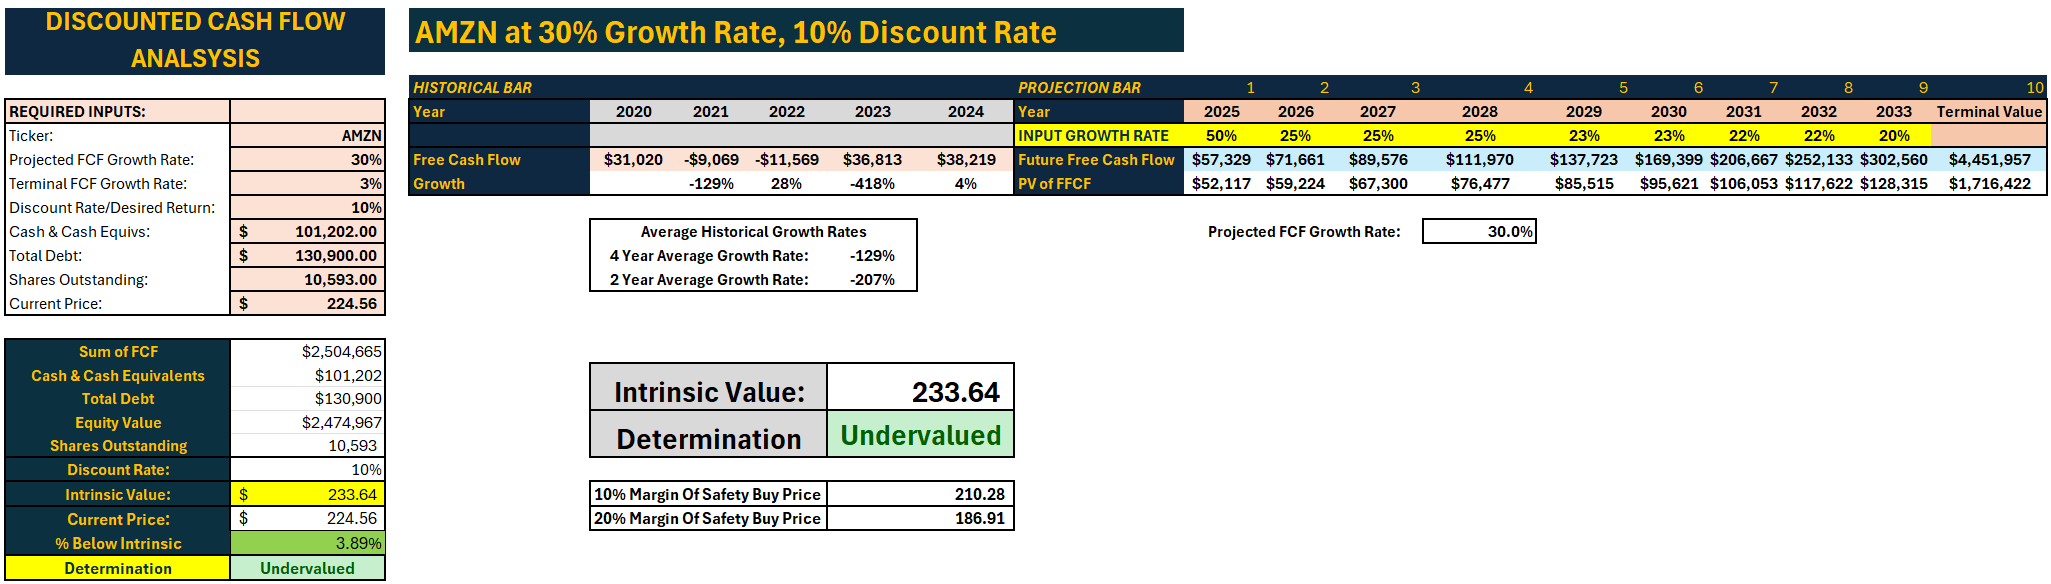
At 30% Free Cash Flow Growth Rate, Terminal 3%
Explanation for my initial 30% assumption:
My quick thought process was that Amazon’s CAPEX has hovered around 40-60b annually since 2020. In 2024 it shot up to 83b (from 53b). CEO Jassy made it clear Amazon is ASAP prioritizing a “once in a lifetime” opportunity with AI buildout and CAPEX spend. If it were not for that I comfortably believe this year's FCF would have been around 55b. That would have been a ~50% FCF growth.
CAPEX is going to keep growing for a few years - AMZN have told us that, but I believe we are going to hit a saturation point with AI Capex spend and that we are currently in an “all hands-on deck” buildout phase right now. I don’t believe it is going to remain this elevated for more than short-medium term. When it lowers, FCF is going to kick up high and the initial jump will be significantly above 30%. Also, AMZN made it clear that they were constrained by data centers for AWS growth so ideally there is fast return on CAPEX and margin expansion resulting in higher free cash flow and then a drop in CAPEX which will lead to a significant leap in FCF generation.
Note I also built in a 20% margin of safety and then kind of took it all into consideration with my P/OCF valuations as well to come up with what I thought was fair and still had some safety built in.
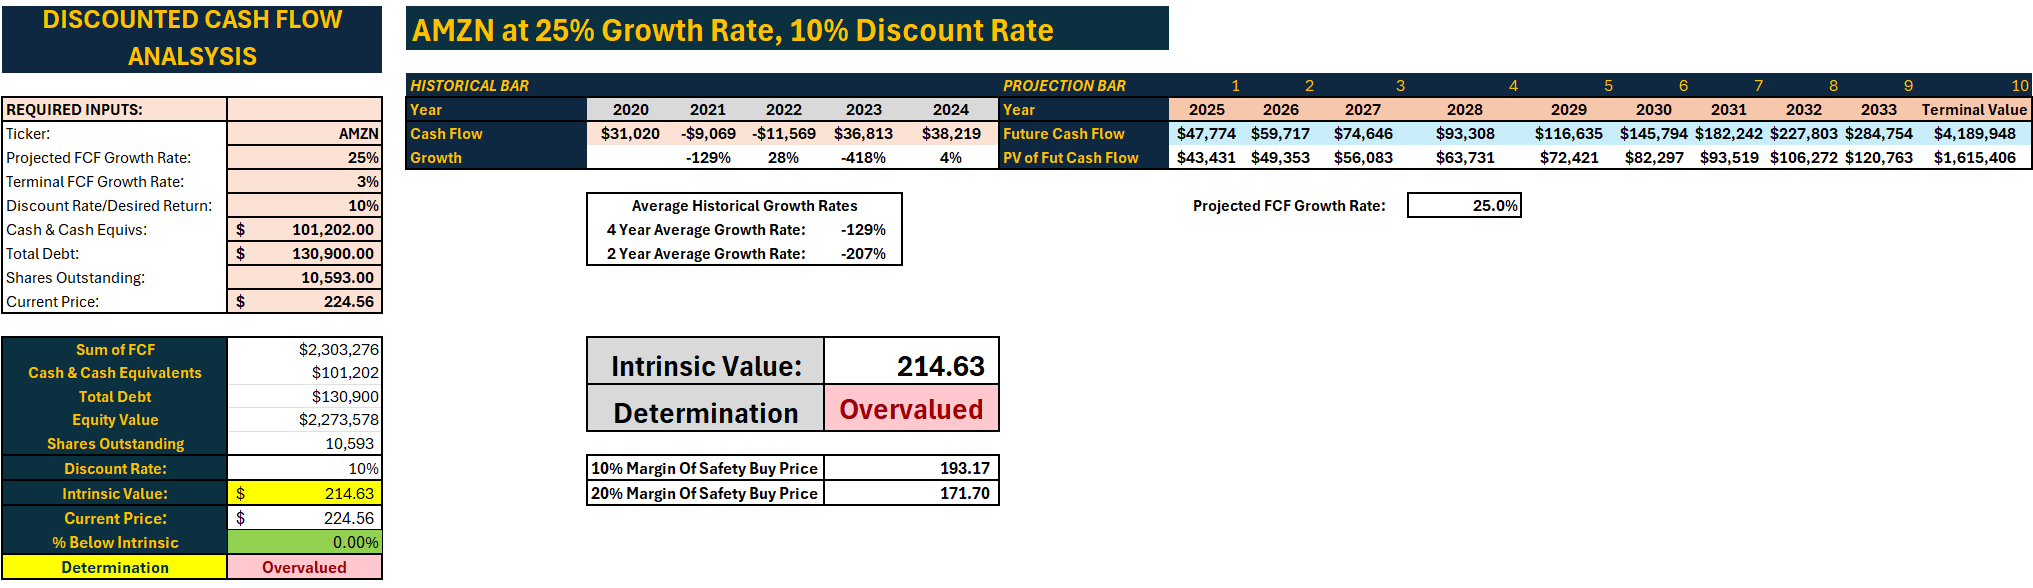
At 25% Free Cash Flow Growth Rate, Terminal 3%: Reflects we are currently around FV.
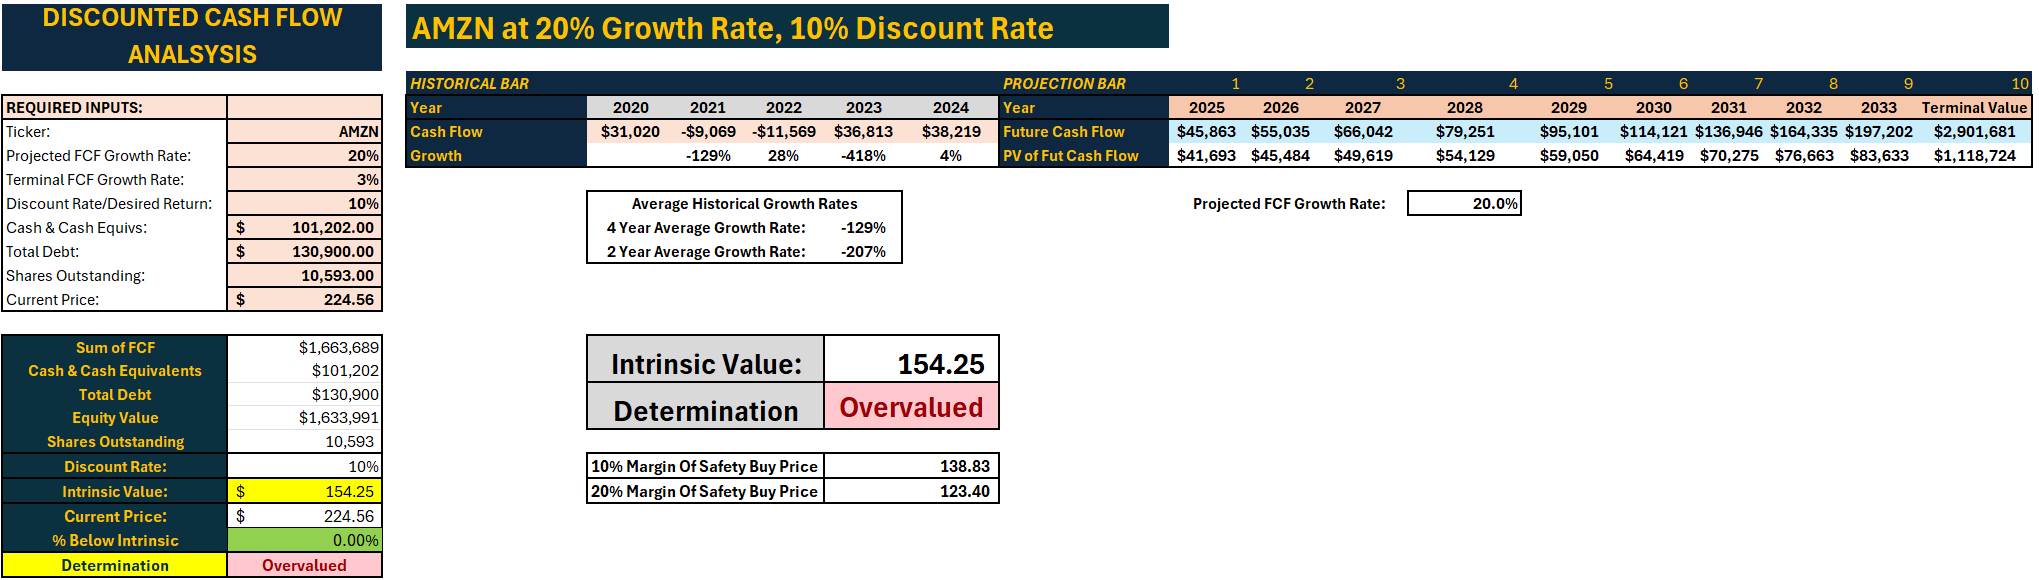
At 20% Free Cash Flow Growth Rate, Terminal 3%: Reflects we are overvalued.
Manual DCF Adjustment: Add: 50% Initial jump in FCF due to return to normal CAPEX, gradual decrease in from 25% > 20% following initial spike, Terminal 3%. Reflects we are undervalued.
Discounted Cash Flow (Using Operating Cash Flow)
Important Note as explained above: I believe Operating Cash Flow to be the best approximator for AMZN valuations.
At 15% Operating Cash Flow Growth Rate, Terminal 3%

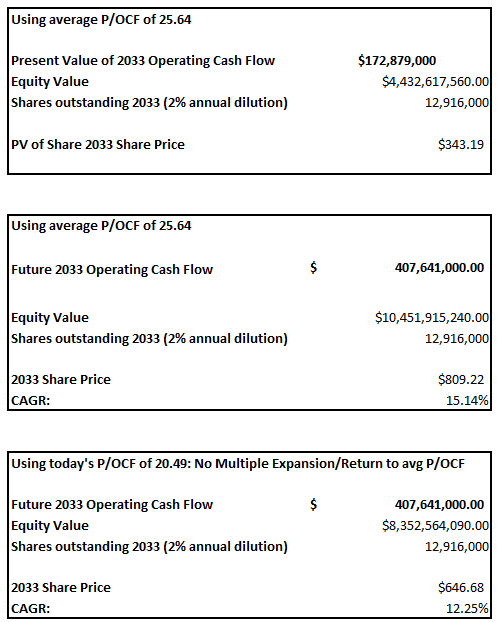
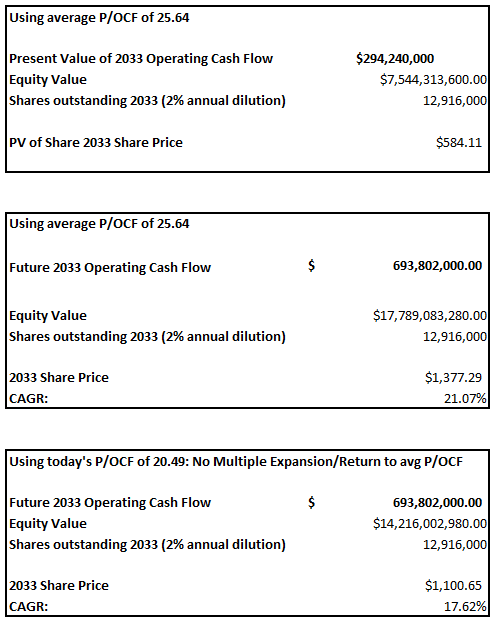
For an alternative calculation of using Future Operating Cash Flow projections, let’s take the Present Value of 2033’s Operating Cash Flow and the estimated 2033 Operating Cash Flow and apply the average P/OCF of 25.64 to get a 2033 share price and a present value of it as well. For the below calculations
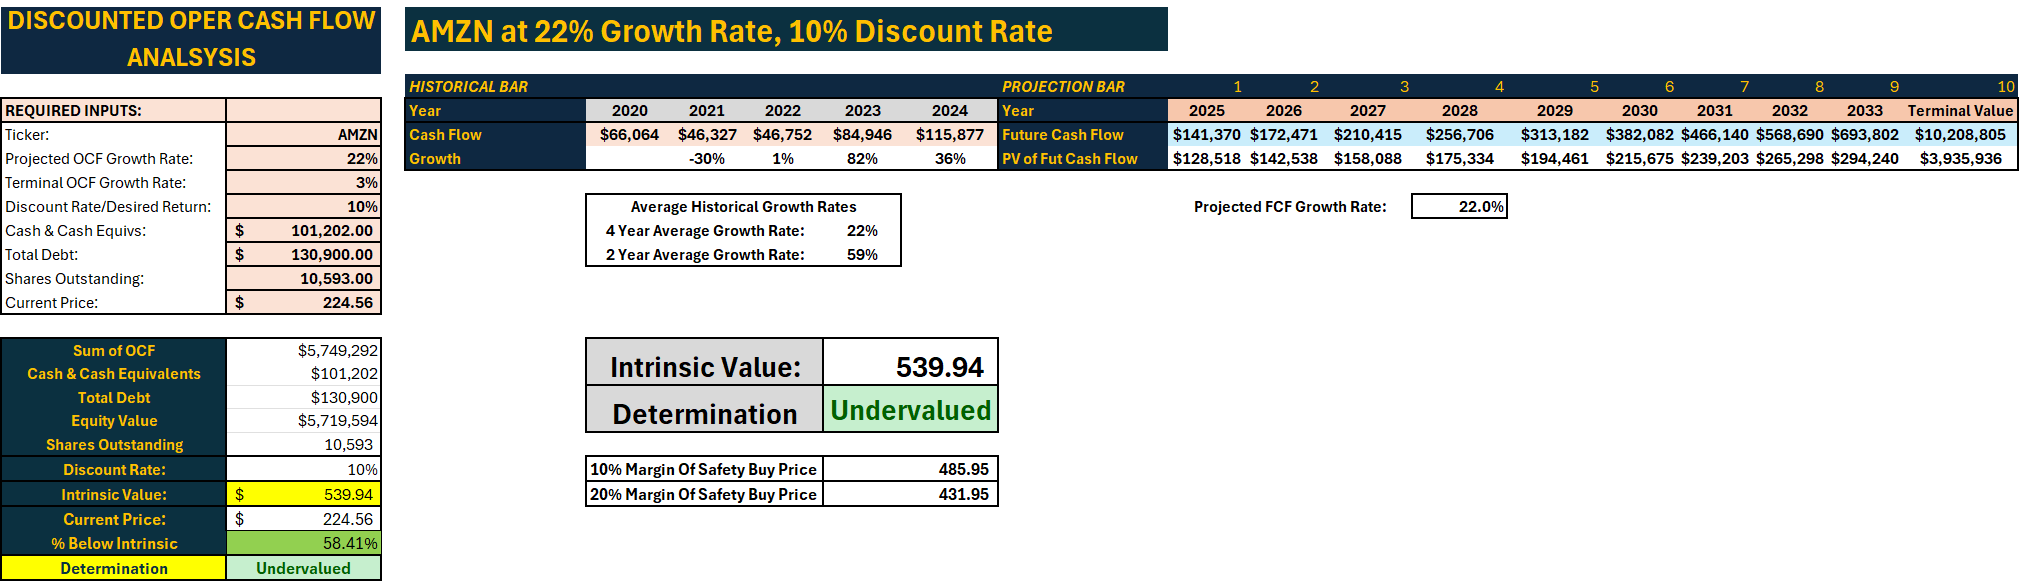
Now let’s look at it using a 22% Operating Cash Flow Growth Rate. This is the average growth rate of last 4 years. For reference: The last 10 years have averaged 34% growth in Operating Cash Flow. Consensus Forward Operating Cash Flow Growth rate is estimated at 27% and a Forward 5-year average estimated at 30.30%.
At 22% Operating Cash Flow Growth Rate, Terminal 3%
OCF Projections Through a different lens…..
Now let’s look at the Operating Cash Flow projections and use them to apply a Free Cash Flow Margin based on Operating Cash Flow to come up with some valuations with a slightly different lens.
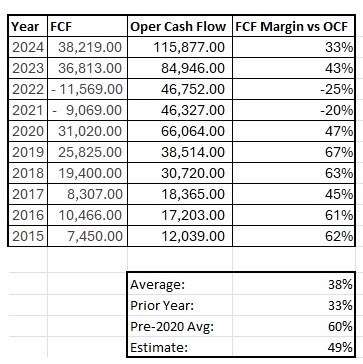
History of FCF vs OCF at AMZN:
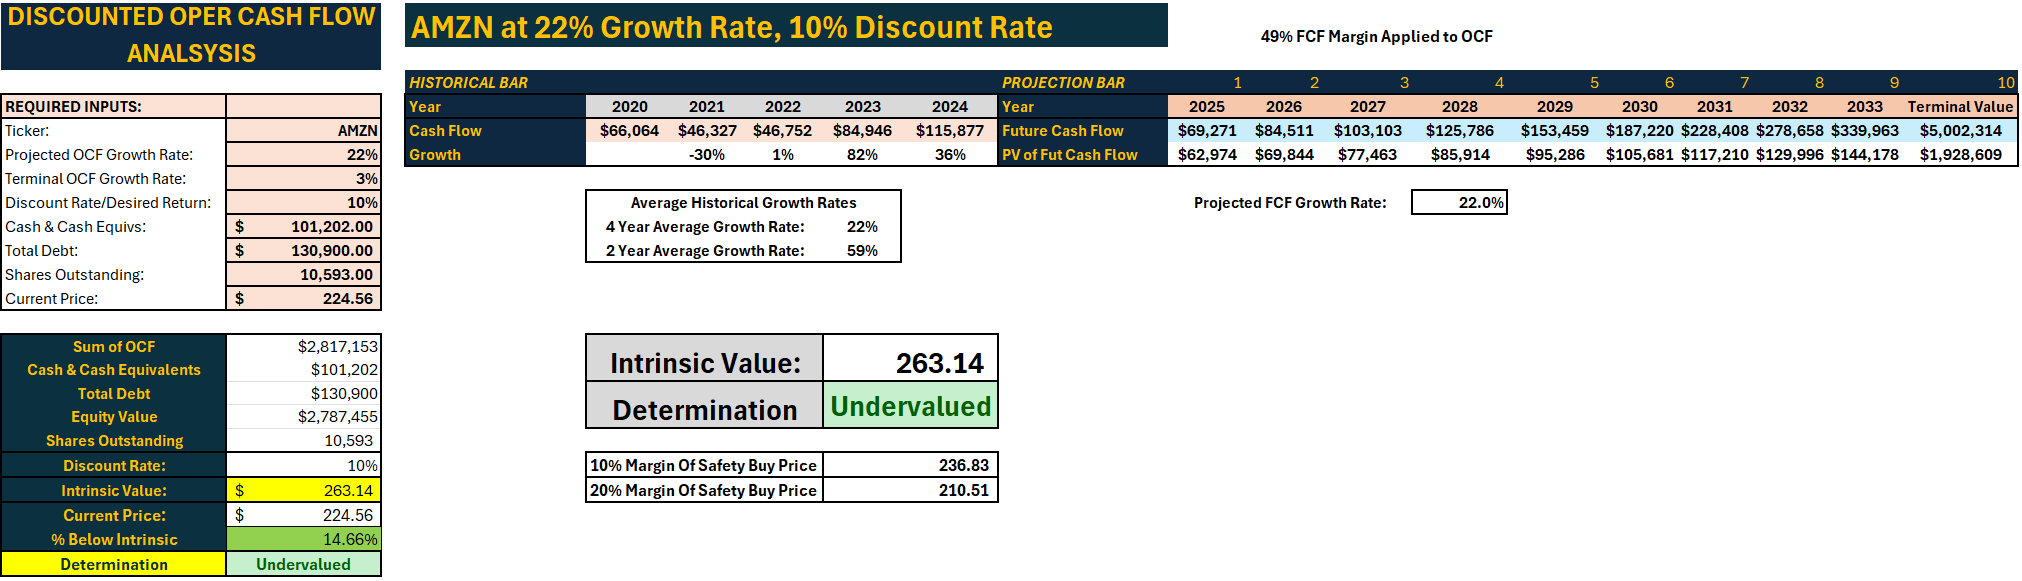
At 22% Operating Cash Flow Growth Rate, Terminal 3% with 49% FCF Margin Applied
This is best case estimate of return to higher FCF vs OCF Margins at a mid-point between LT Average and Pre-2020 Average Margins.
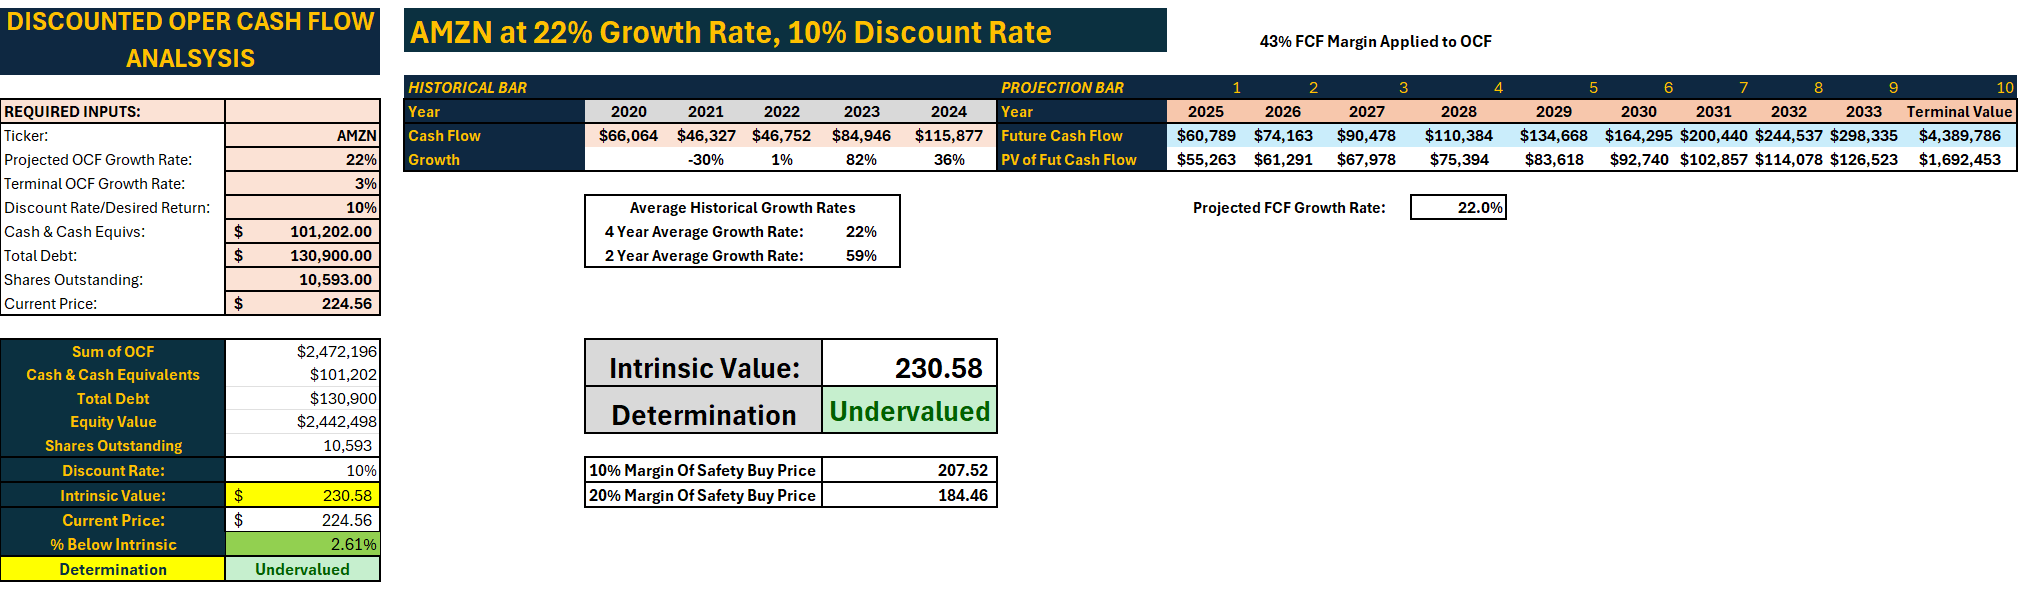
At 22% Operating Cash Flow Growth Rate, Terminal 3% with 43% FCF Margin Applied
This is applying assumption of return to 2023 levels of FCF vs OCF Margin
TLDR:
The cash flow models - those are calculating an intrinsic value today that takes into account future growth. My initial fast Price to Operating Cash Flow valuation was just taking a snapshot of THIS moment and comparing it to what AMZN historically trades at valuation wise using P/OCF multiples. The Cash Flow models have higher intrinsic values because they account for growth ... but if you compare the Margins of Safety etc.....
My initial quick calcs using P/OCF ratios said FV Buy at $221 (low) - $254 (high) and I end up between $193 and $210 for as buy points using the cash flow projections and applying a margin of safety.
TLDR: That would lead me right now to make the decision to pretty confidently call it a BUY below $201.5. I believe there is conservative room for value at $210 and would buy at this price if I was still trying to build out a position.
*Note: This valuation walkthrough was written prior to AMZN’s recent drop in price making it an even more compelling buy for me.
Disclaimer: The content shared on Fundamentally Sound is for informational and educational purposes only and should not be considered financial advice. Please do your own research before making any investment decisions.
Well put. I think $AMZN will always have a high capex level. Given that I also prefer to use OCF to model out like you did. And here we are today at $192 where price is much more attractive
I thought I was the only one using FASTgraphs on Substack. ))